Database system for Palaeontologists and Biologists
|
|
PaleoTax Database system for Palaeontologists and Biologists |
| Home | Download | Information | F.A.Q. 2.0 (German) | Tour (2.1) | User | What's new ?
| F.A.Q. 2.x | (English) PaleoTax/ | Map Version 2.6
| |
In May 2021 Service Release 2 was published that brings the following improvements:
Oliva SR3 was published in May 2022.
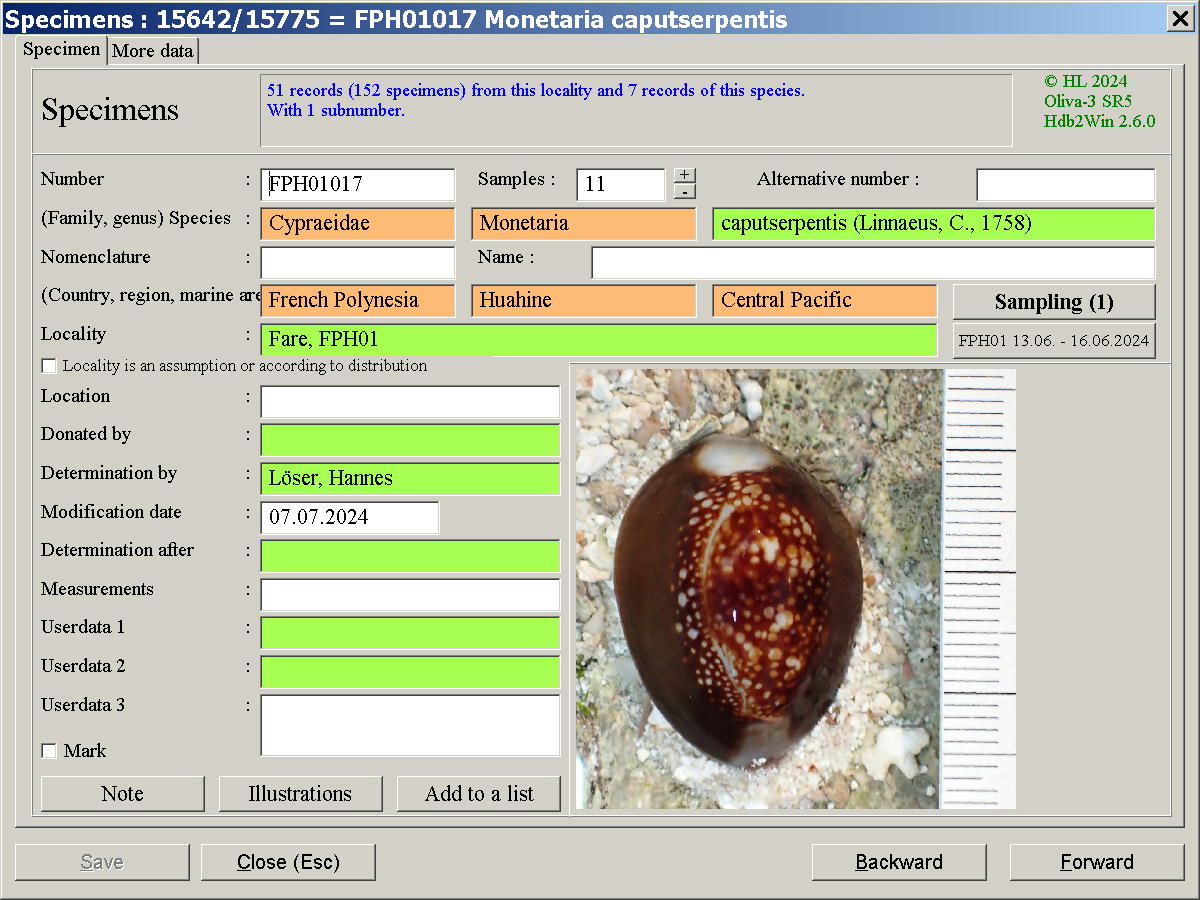
The main form is that of the specimens. Green coloured data fields connect to other tables. An entry of this table may collect various samples (or no sample at all if it is only an observation). Double click in the field "Species" leads to the corresponding record in the species table. The depicted image is the first or a marked image.
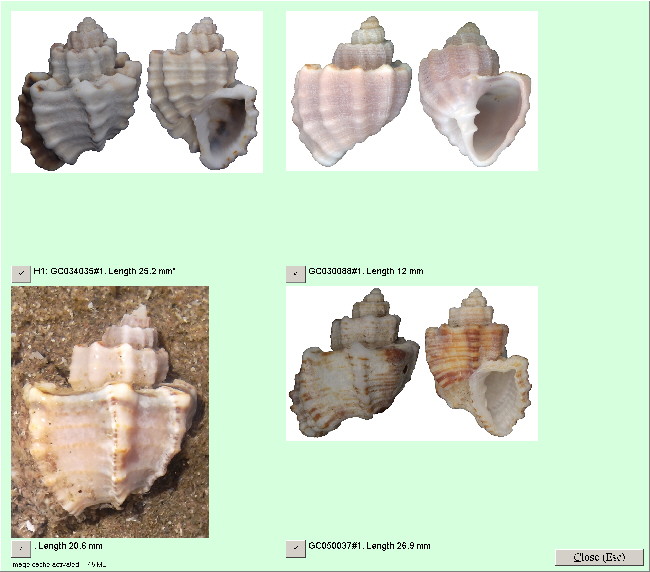
Next important table is that of the species. The box on the left bottom lists all entries of the species. The application helps to generate the little map (GPS data must be recorded in the table of the sites). A click on Images collects all images of this species and shows them in an album (see below).
A click on Size shows measured specimens in a table. The red dot marks the maximum size reported by the literature, the green one the average of measured specimens. The chart is based on data recorded in the table of sub-numbers, and the field Maximum size in the species table.
A click on Facies shows the facies distribution of the species. The chart is based on the indication of the species at localities for which facies data are recorded.
The table of genera shows a list of all species with their species and respective numbers.
The table of sub-numbers is to record measurements and images of single specimens that belongs to an entry in the specimen table.
The table of sites is to record the exact location of the finds with their GPS data and facies. The table on the second page lists all species of the site. Numbers in red are the result of data analysis.
© Hannes Löser, Hermosillo, Sonora, Mexico.
Oliva is a structural design for recording extant organisms. It is clearly designated for collection material and observations. The taxonomic part is – compared to PaleoTax – strongly reduced. Oliva was published with the program update 2.4.2 in May 2020, together with a detailed manual in the English language.
Oliva SR4 was published in May 2023.
Oliva SR5 is under preparation for March 2025.
Specimen table
Species table


Sub-number table

Locality table

Updated : 10-12-2024.